
About Us
ADD/ADHD News
ADDerwards
Creative ADDers
Donate
Ecosse ADDers
Events
Forums
Games Corner
Information
Links
Research
Resources
Support Groups
Whats New
Free To Try
Graph Maker
Download Graph MakerGUARANTEED 100% CLEAN
Our Files DO NOT Contain Adware, Spyware, Viruses, Toolbars Or Any Other Third Party Software
Portable Licence: This portable program is provided free of charge for use on a memory stick and is not to be copied to any computer hard drive. Simply download the zip file (to the memory stick if you wish). Then open the zip file and extract the contents to your memory stick. A folder will be created 'Olltwit Portable Apps'. Inside you will find the program folder. Double click the program file inside that directory to run. Installation versions of these programs can be found here.
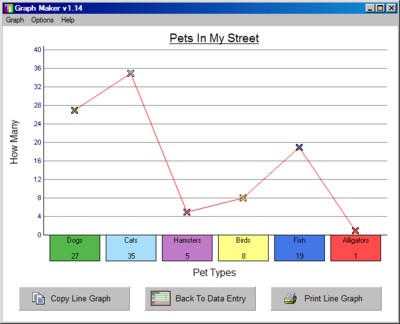
Create line graphs with Graph Maker
(Colours and size of screenshot reduced to fit page)
Suitable for UK Key Stage 1, 2, 3, 4 & 5 - USA 1st to 12th Grade (Age 5 - adult)
Making bar graphs, line graphs and pie graphs is easy with our program. Just enter the data and choose the type of graph you want to build. You don't need to worry about the values shown on the x and y axis as the program works these out for you automatically. Save the data to open or edit later. Print out your graphs or paste them into another program e.g. Microsoft Word, Works or similar.
With Graph Maker you can easily add data, labels and much more to produce bar graphs, pie graphs and line graphs. It adds so much to any presentation or article to add a graph and with Graph Maker it's easy with the copy and paste facility. Graph Maker allows you to produce professional looking graphs for school projects and much more.
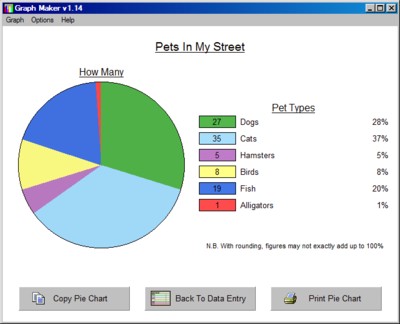
Create pie charts with Graph Maker
(Colours and size of screenshot reduced to fit page)It's also a great educational tool to be able to make a graph of your statistics. Even young learners can use Graph Maker, to show data in an understandable graphical style. From a graph you can easily tell which is the most popular, who jumps the longest, what are your classmates favourite colours, what is the most popular pet and much more. Pie charts or pie graphs, also give an insight into fractions and how proportions are calculated. All is done for you in the program, you just enter the data, then click to create a graph. Watch as it draws the pie graph before your very eyes. Then you can copy and paste it into your presentation or simply print it out. Recommended Minimum System: PC, Windows e.g. XP, Vista.

Information Links ADDers.org News Research Resources Search adders.org
Site Map Social Stories Sponsor Events Student/Researchers Support Groups Supporters

FREE DVD or CD